Contents
Reclaim your day with these MTTI-fighting techniques
The most inefficient use of your team’s time is spent proving that they are not the cause behind a network issue.
This white paper considers why MTTI happens, when in a workflow it occurs, and technology that can empower teams to skip over it altogether.
Our solution brief drills down on:
- The most important packet header components for troubleshooting
- Top NPM features that help you escape MTTI
- Common troubleshooting metrics for NetOps workflows
Don’t waste time pointing fingers. Unify your focus on faster MTTR with LiveAction’s packet capture products.
Executive Summary
This white paper examines mean time to innocence (MTTI), how it is defined, where it fits in a troubleshooting workflow, and how and why to remove MTTI.
Enterprises need a shift in mindset from covering individual silos of responsibility towards collaborative action. Mitigating MTTI can change the paradigm.
Introduction
Between 2015 and 2021, internet users around the world increased fivefold to over 4.9 billion. As more of our lives, careers, and daily functions shift increasingly online, networks only grow in complexity.
This ever-expanding complexity can make your network seem like a blackhole for problems to hide. When things do go wrong, the prerogative for each party is to prove they are not culpable. This is easier to achieve than taking on the black hole to find the actual issue.
The race to innocence involves everyone. Network engineers must prove it is not the network’s fault. The application developers must prove it is not the application’s fault. The systems engineers must prove it is not the fault of the IT systems etc.
The amount of time it takes to prove this innocence is what we call the mean time to innocence (MTTI). This white paper looks at where MTTI exists in the troubleshooting lifecycle and tools that can remove MTTI from an enterprises’ troubleshooting response.
Mean Time to Innocence
MTTI is an unnecessary use of resources. The energy and time that go into backtracking, creating, and sharing evidence of who is not at fault, could be better allocated to narrowing down where the problem exists. MTTI falls towards the top of the actions in a troubleshooting workflow. Let’s familiarize ourselves with some common metrics.
Common Trouble Shooting Metrics
Mean Time to Detect (MTTD)
This is the amount of time between when the problem occurs and when the problem is detected.
Mean Time to Innocence (MTTI)
This is the amount of time it takes from detection to prove that the problem is not caused by products, tools, or systems the party is responsible for.
Mean Time to Investigate (MTTI)
This is the amount of time between when the problem is detected and when the formal investigation begins into what caused the problem.
Mean Time to Repair (MTTR)
This is the amount of time it takes from detection to when the problem is repaired, but not necessarily when it is rolled out to end-users.
Mean Time to Restore Service (MTTRS)
This is the amount of time that passes between detection and service restoration to customers.
Mean Time Between Failures (MTBF)
This is the amount of time between MTTRS and MTTD. This metric establishes a track record for what components in a system are less likely or more likely to fail.
Escaping MTTI
Having total visibility into a network and all its endpoints and dependencies accelerates the ability to drill down to the problem, making MTTI obsolete.
To eliminate the MTTI scramble, you need to get down to the detail of the packet data.
Packet capture is the act of creating copies of the Internet Protocol (IP) packets passing through the network. These copies can be examined to reveal points of failure in the network and even security concerns.
Packets are literal copies of network traffic. If you know what indicators to look for, they will reveal the source of the problem.
Packets are made up of headers and payloads. The payload contains the data being sent across the network, and the header contains details about the source, the destination, the protocol, the class of service and more. In fact, there are 14 components that make up a packet header.
Packet capture is the act of creating copies of the Internet Protocol (IP) packets passing through the network.
We’ve highlighted the six packet header components that are most important for troubleshooting:
- IP Source
- IP Destination
- Version
- type of Internet Protocol used like IPv4 or IPv6
- Header Length
- Type of Service
- QoS, Differentiated Services Codepoint (DSCP), and explicit congestion notice (ECN)
- Total Length
- Identification
- IP Flags
- Fragment Offset
- TTL (Time to Live)
- Protocol
- DNS, ARP and DHCP
- Header Checksum
- IP Option
The payload of the packet contains valuable information too, like exactly where a user authentication transaction fails. You can look at the requests sent out to the server and the results the server sends back (if any), including error messages. This information from error messages can point to a specific problem in an application. You can also easily spot a network segment with a broken or congested link because no return confirmation is sent back.
Packet capture and analysis can be achieved with both commercial and open-source solutions. It is best when the packet capture solution is integrated with the network performance monitoring solution, allowing users to quickly pivot from flow-level to packet-level analysis. Packet analysis has been widely used by NetOps for decades for detailed network troubleshooting, but this is becoming more complex as the use of highly-secure encryption accelerates. Unfortunately, Google estimates that 95% of its traffic is encrypted and very few packet capture tools can see within the encrypted data of a payload, especially when the newest versions of encryption, like TLS v1.3, are used.
The right features in your Network Monitoring Platform (NMP) can not only extend your visibility to encrypted traffic, but also leapfrog you directly from MTTD to MTTR.
Google estimates that 95% of its traffic is encrypted and very few packet capture tools can see within the encrypted data of a payload, especially when the newest versions of encryption, like TLS v1.3, are used.
We’ve compiled a list of NMP features that will accelerate the path from detection to the root cause:
- Global end-to-end visibility of the entire network
- If you can see the issue, you can fix it. These are the areas of visibility you need to cover:
- Vendor-agnostic visibility
- Third-party application visibility
- Network-agnostic visibility
- This should extend to all types of networks, including SD-WAN, Hybrid WAN, MPLS, Multi-Cloud, WiFi, Remote sites, and data centers
- If you can see the issue, you can fix it. These are the areas of visibility you need to cover:
- Forensic packet capture of network traffic, including encrypted traffic
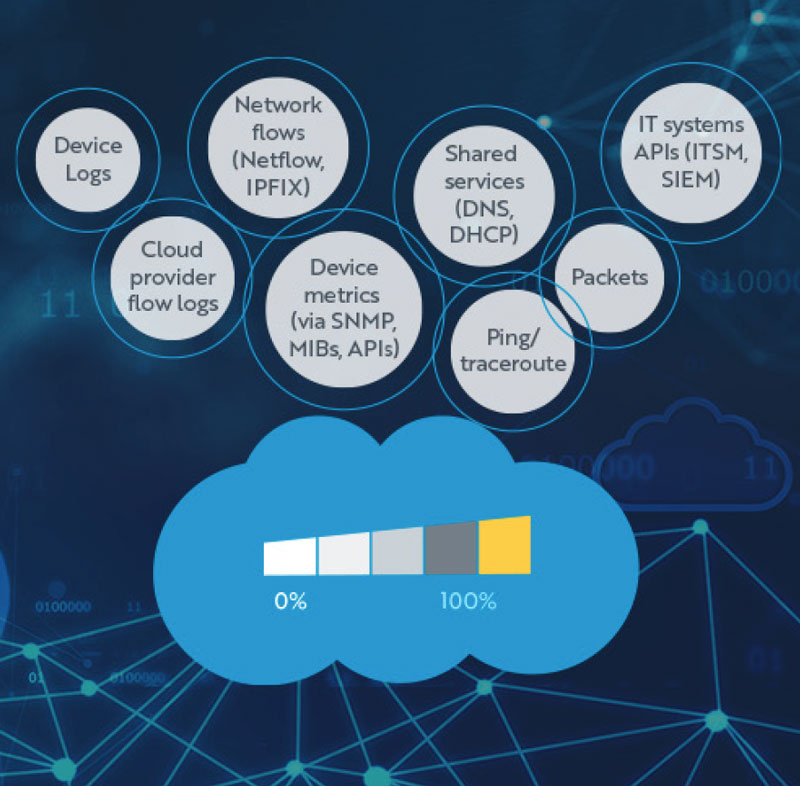
- Ability to correlate data between IPFIX, Packets, API and SNMP data
- Advance Analytics & Reporting that consider multiple data types
- Artificial intelligence (AI) and machine learning (ML)
- These advancements allow NetOps to make proactive progress on complex network issues.
- These technologies bring deeper insights by identifying patterns based on historical data and applying predictive logic to prevent future network problems.

Conclusion
Valuable time is wasted proving who/what did not cause a network outage or impact. A process-of elimination approach is not an efficient way to identify issues. According to a 2019 study by APM Digest, 42% of NetOps responded that they spent too much time troubleshooting the network. The right technology can empower NetOps to prioritize forward progress.
Download Whitepaper
Mean Time to Innocence
About LiveAction®
LiveAction provides end-to-end visibility of network and application performance from a single pane of glass. We provide enterprises with confidence that the network is meeting business objectives, full network visibility for better decisions, and reduced cost to operate the network.


