Contents
Expand your network monitoring capabilities with the security intelligent LiveWire Edge
According to a recent ChannelFutures report, 75% of respondents believed SecOps needed improved network visibility. NetOps teams reported spending more than 35% of their time on security issue investigation and resolution.
This solution considers the capabilities of LiveWire Edge to extend network visibility from core to cloud to WAN edge, its ability to create flow from packets, and its powerful threat combating DNA.
Download our solution brief that drills down on:
- Technical details around integrations and requirements
- Use cases for security-sensitive organizations in the field
- Features like millisecond mode and threat investigation
- ACI monitoring
Or Sign up for a demo!
Challenge + Solution
Challenge
When a problem like latency or jitter has been reported for a particular application, it can be challenging to determine precisely what caused it. Inability to find the root cause problem means unresolved help desk tickets, frustrated end-users, and a high likelihood for the unidentified and unresolved issue to pop back up.
Solution
LiveWire Edge
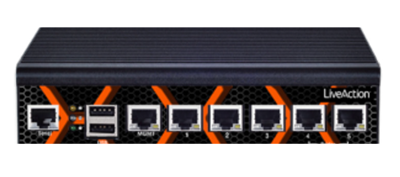
LiveWire Edge is the most powerful network protocol analyzer. It analyzes packets to identify network events. It considers over 200 different expert event diagnoses for what the problem could be. LiveWire provides historical playback and real-time network and application latency and jitter views.
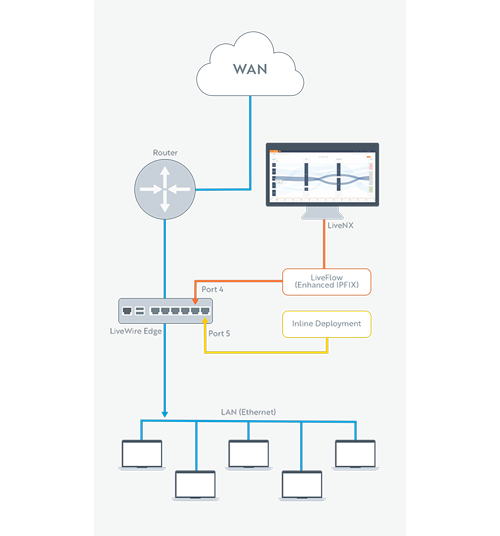
By using a network tap or bridge to mirror traffic, LiveWire monitors packet data without impacting the performance of production network traffic.
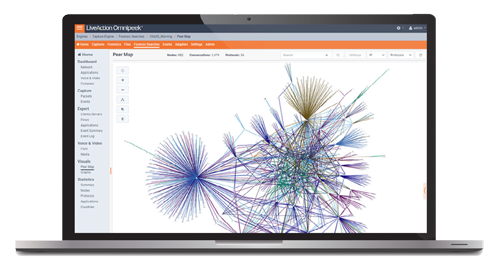
LiveWire Edge includes an award-winning built- in web UI called Omnipeek. Omnipeek allows any number of approved users to securely log in from any web browser and simultaneously access network data. LiveWire delivers hardcore packet analysis, local wired and wireless capture and analysis, and Windows protocol analysis.
LiveWire Edge Benefits
LiveWire Edge Benefits
- LiveWire Edge includes Omnipeek & 1 free license of LiveNX
- Cost-effective network visibility across large numbers of branch and remote locations
- Smallest, most versatile and powerful NPM and NDR device in the industry
- Faster mean time to repair with advanced troubleshooting and root-cause analysis
LiveWire + Omnipeek
- LiveWire is integrated with Omnipeek for web to quickly identify and resolve network performance issues anywhere they happen
- Quickly identify and resolve network performance issues anywhere
- Accelerate mean time to resolution (MTTR): fast visualization and interaction with metadata, flows, files, and packet data
- Gain unrivaled visibility into networks and applications
- Leverage expert insights and analysis to network challenges with built-in, real-time analysis of hundreds of common network problems
LiveWire + LiveNX Integration
LiveWire is tightly integrated with LiveNX for packet capture to a centralized data dashboard where it is correlated with netflow for enhanced network visibility.
- Collect and analyze data directly from network devices for insight into design, policy verification and operations for an optimal customer experience
- Get a direct link to network packets for detailed, root cause analysis from a single platform
- Gain visibility across the entire network with application aware Netflow visibility where traditional visibility gaps exist
One dashboard monitors all latency and jitter across the entire network at scale. Once notifications are configured, targeted alerting can be sent based on a threshold. This allows you to pro-actively investigate and solve latency and jitter issues before the trouble ticket hits your desk or even gets reported. In other words, LiveWire and LiveNX together provide total network visibility.
Advantages
DMS Platform
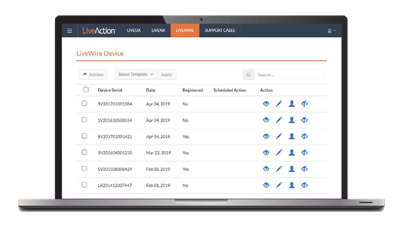
Make bulk changes easily with SaaS-based Device Management Services. LiveWire Network Devices can be managed from anywhere with our SaaS-based Device Managed Service (DMS) platform included with every LiveWire device.
LiveWire makes configuring and managing numerous devices at remote sites through a central console.
Enhanced Visibility
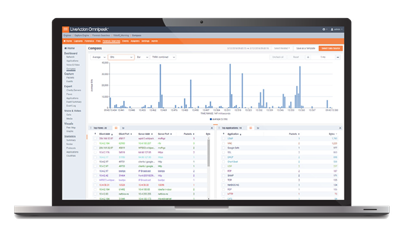
LiveWire monitors latency and jitter, even over layer 7, including WebEx, Zoom, Outlook, Salesforce, and other mission-critical applications. LiveWire uses deep packet inspection and IPFIX flow-based analysis to identify over 2000 applications. Paired with LiveNX unifies packet and flow data into one visual dashboard.
Flexible Sizes
LiveWire is packaged in different forms to provide maximum flexibility for budget and size appropriate for each network segment. But no matter whether it is our largest high-speed capture appliance, or our smallest appliance, about the size of a book with no moving parts, or virtual running in your network or the cloud like AWS, the UI is completely the same.
Technical Details
LiveWire Edge
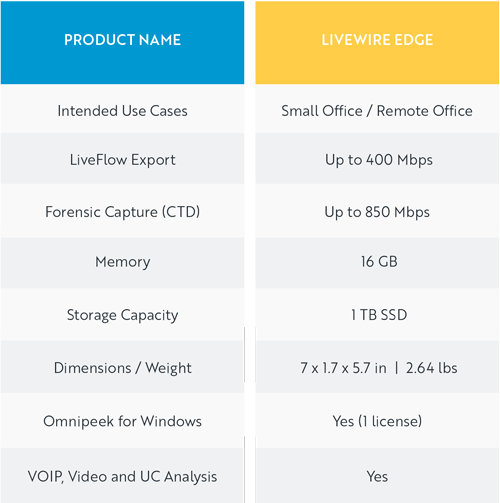
- 3 built-in 1G ports for spanning traffic from different types of network devices like switches and routers
- 1G Bridge for connecting the small device inline between cable modems and firewalls
- Captures all traffic to 1TB SSD while load balancing flows over multiple cores for maximum performance
- Generates advanced analysis like network & application latency & VoIP jitter analysis
- All analysis sent as enhanced IPFIX to the LiveNX dashboards for alerting and reporting
Use Cases
Remote Site Visibility
New Digital-first companies with remote office sites that are geographically disparate from the rest of the network can now extend visibility to remote sites at the WAN edge and branches, cloud, and LAN. Critical visibility for remote networks in several industries:
- Field R+D engineering teams
- R+D teams struggle to get network visibility in the field
- Need to quickly identify and troubleshoot problems in the network before disruptions occur
- Need to be able to work in the field and still check on customers via Wi-Fi
- Need equipment that is not only reliable, but can withstand harsh environments
- Defense agencies
- Defense Agencies struggle to get network visibility in the field
- Need to quickly identify and troubleshoot problems in the network before disruptions occur
- Require the ability to not only capture packet data but share it with others via Wi-Fi connection
- Need equipment that is not only reliable, but can withstand harsh environments
- Offices
- Hospitals
- Banks
- Warehouses
- Hotels
- Retail stores
Application and Network Latency Identification
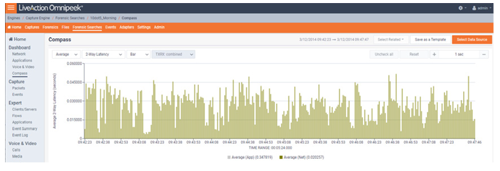
The debate about whether the latency is from the network, or the application never ends, and unfortunately the network is guilty until proven innocent. With LiveWire, mean time to innocence (MTTI) is quick and easy, visually showing the network and application, along with flow ladder transaction diagrams, and other analysis to help the vendor or application team solve the problem.
VoIP Jitter Analysis
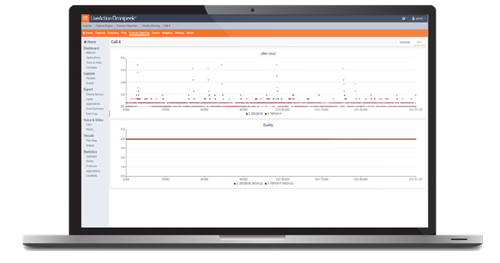
LiveWire recognizes most VoIP codecs and provides jitter measurements and other analysis to identify and troubleshoot VoIP call problems. With the Voice & Video Flow Visualizer, a ladder diagram shows the call setup and the RTP. The RTP Jitter graph displays the jitter over time for each media flow and codec.
In-The-Field Flexibility
LiveWire provides an on-the-move, stable network for those in the field or changing locations. LiveWire can capture wireless traffic using a USB dongle.
Data Center Visibility
Enterprises often struggle with the opacity of data centers. LiveWire solves that through router mapping. Many segments can be aggregated into a single LiveWire and then separated back out again using a technology called Router Mapping. Router Mapping allows you to specify the MAC address of upstream routers that will be used to separate the traffic as different interfaces in LiveNX.
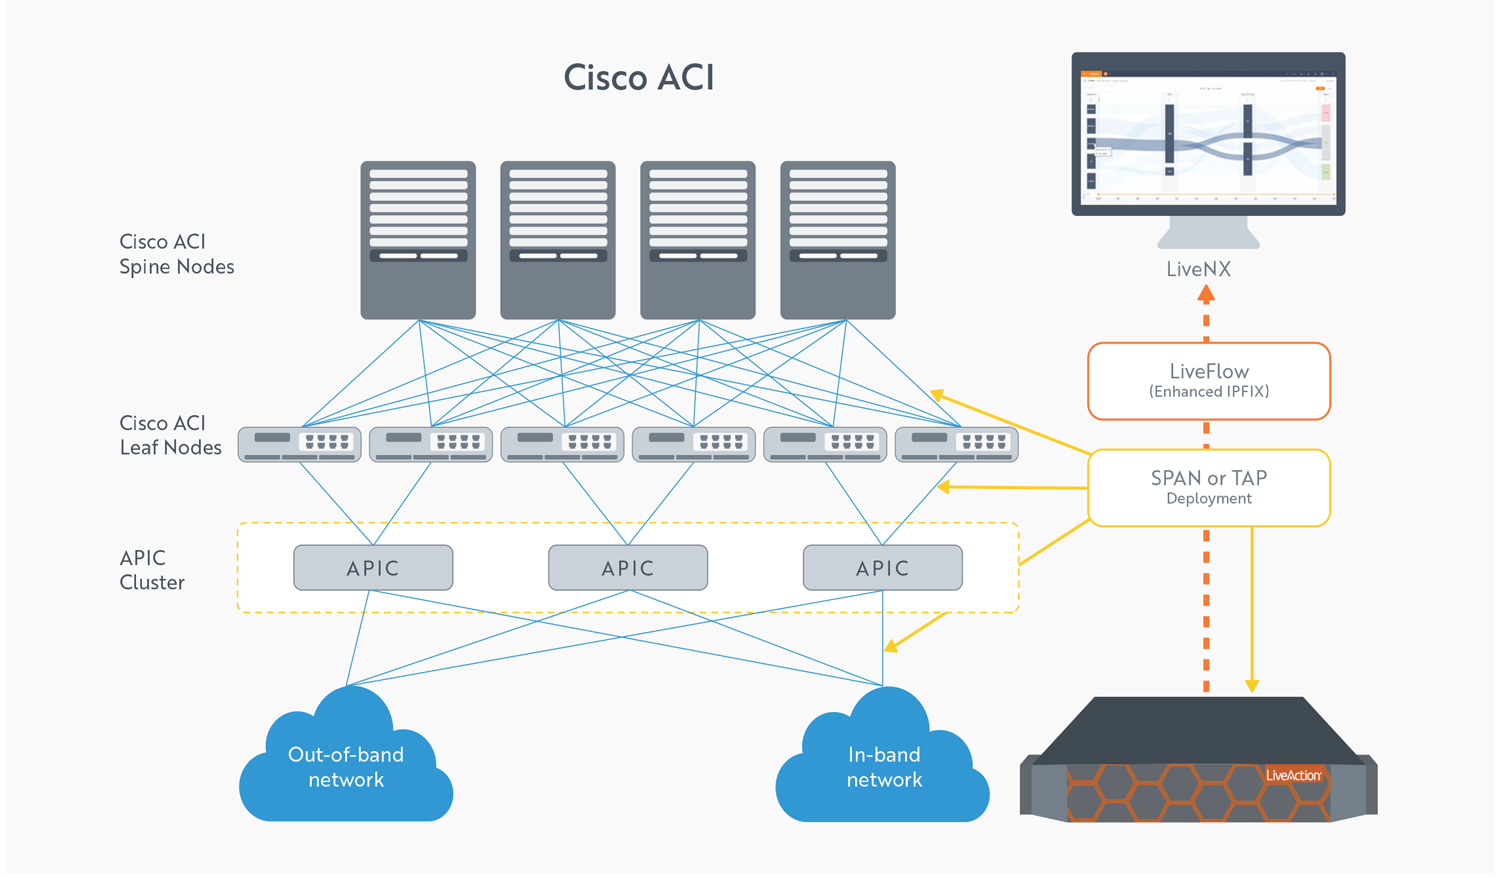
ACI Monitoring
LiveWire allows for monitoring ACI through ERSPAN or tapping. LiveWire resolves packet analysis limitations of ACI monitoring with advanced flow generation. The Enhanced Netflow IPFIX can encapsulate Cisco ACI VXLAN Network Identifiers (VNIDs) for visibility of Spine/Leaf traffic flows.
Security Investigation
With ThreatEyeNV enabled, security alerts will identify threats to your network, and cross-launch back to the packets in LiveWire. Using the built-in Omnipeek UI for LiveWire, security investigators can use many types of analysis to understand where the threat came from, what payloads or files were transferred, what other nodes were affected, what protocols were used, and other workflows to better understand what happened.
Millisecond Mode
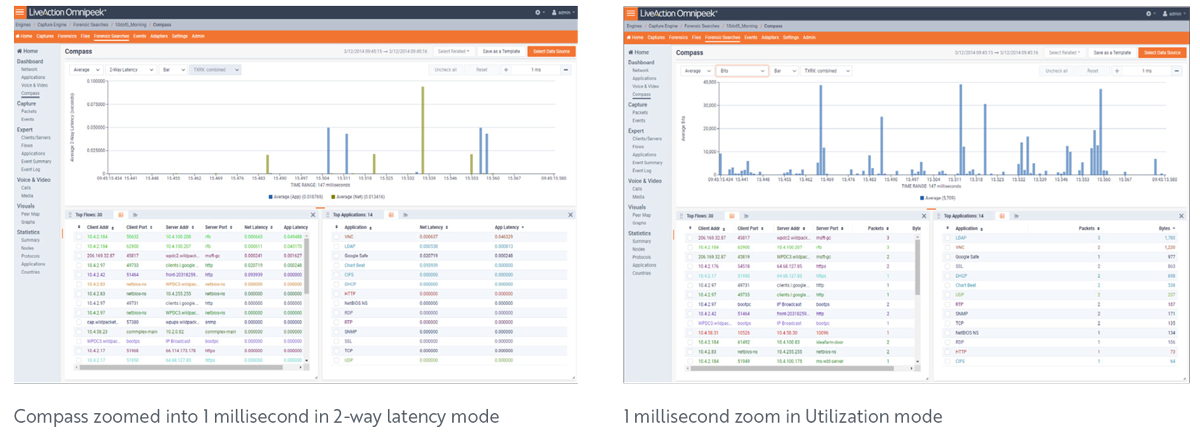
If the problem is within a micro-burst, LiveWire can zoom into milliseconds mode in an interactive graph. This level of zoom is critical to organizations in the financial industry. With the stock exchange and today’s high-speed trading transactions can take place at a millisecond level. 1000 milliseconds make up a second, and in many cases full second intervals are not granular enough.
Other products claim 1 millisecond zoom, but their graphs are static and often only perform utilization. LiveWire Edge can perform several different measurements at this granularity, with a dynamic and interactive graph.
Summary
LiveWire provides 1000 points of data for each second on statistics like utilization, latency, retransmissions, protocols, flows, applications, and others. Each metric can be graphed together an interactive way, providing correlation and insight. From the graphic display users can zoom in to the packets by specific time-range or item selected. LiveWire Edge expands your network knowledge through extended sight to every segment of the network.
By integrating LiveWire Edge into your network, you will gain access to LiveAction’s most powerful tools to gain full visibility into your network and unlock the performance your network and set your network up for scale.
Download the White Paper
About LiveAction®
LiveAction provides end-to-end visibility of network and application performance from a single pane of glass. We provide enterprises with confidence that the network is meeting business objectives, full network visibility for better decisions, and reduced cost to operate the network.


