The worldwide cloud services market is forecast to grow 17% in 2020 to total $266.4 billion, up from $227.8 billion in 2019. As cloud adoption increases, organizations are working to ensure the proper security measures are in place. But having the right solutions and the level of visibility needed to conduct security analysis, incident response and active troubleshooting can be a real challenge for IT.
Overcoming these obstacles requires clear and deep visibility into accepted and rejected network and cloud traffic. If architects and engineers can’t identify the origin and destination of traffic into and between their virtual private clouds (VPCs) – and they can’t visually determine if certain traffic is accepted or rejected – how can they actively conduct security analysis and incident response from a network perspective? Fortunately, LiveNX now includes cloud monitoring capabilities for AWS and Azure. This means the platform is the only unified solution for end-to-end visibility from the network to cloud, and it gives IT teams access to the same in-depth level of analytics across their public cloud workloads as they already have for their core network. These new capabilities can help analysts, architects and engineers conduct security analysis to understand security group policy, and do incident response work. This includes visibility into cloud devices, sites and applications; topology filtering and drill-downs in reports; mapping traffic to Geolocation; and searching by service, IP, port, and more to see where traffic has been.
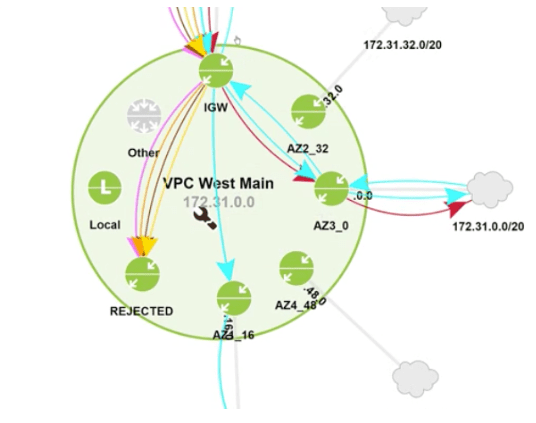
 Let’s quickly look at how you can use LiveNX to better validate a security group policy. In this scenario, you want to understand what traffic is being allowed (and is that correct), and what traffic is being rejected (and if so, analyzing those if they are attacks). In the following image you can see a VPC mapped with the internet gateway at the top (at approximately 12 o’clock in the circle), and then around the horn are various subnets connected to the VPC, including a rejected interface (at approximately 7 o’clock).
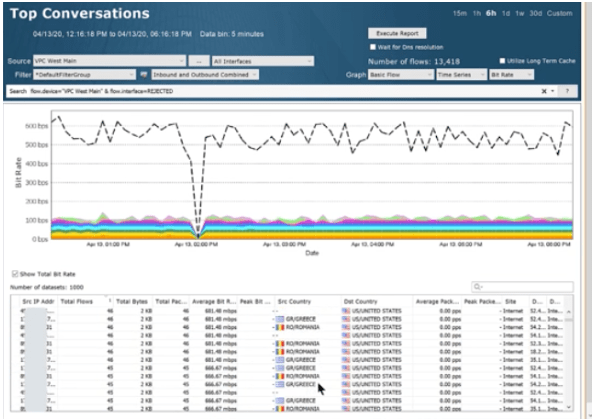
 By clicking through the rejected subnet and clicking into reports and address pairs, you can dive in and see addresses, source IP, countries and more for this rejected traffic. From there you can pivot with a simple click to see what the source country is for all traffic coming into that VPC.
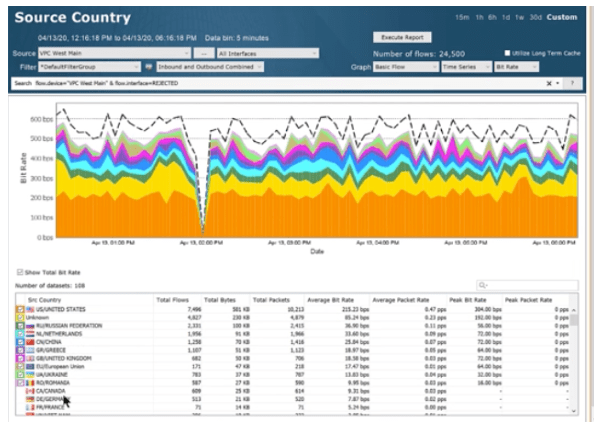
Here we now see a report showing the source country for the rejected VPC. And it shows there is a lot of traffic coming from countries not authorized by the security policy. This makes it easy for you to validate that the security group policy is actually working.Want to see this feature in action? Click through to this quick video tutorial or schedule a demo today.


