Contents
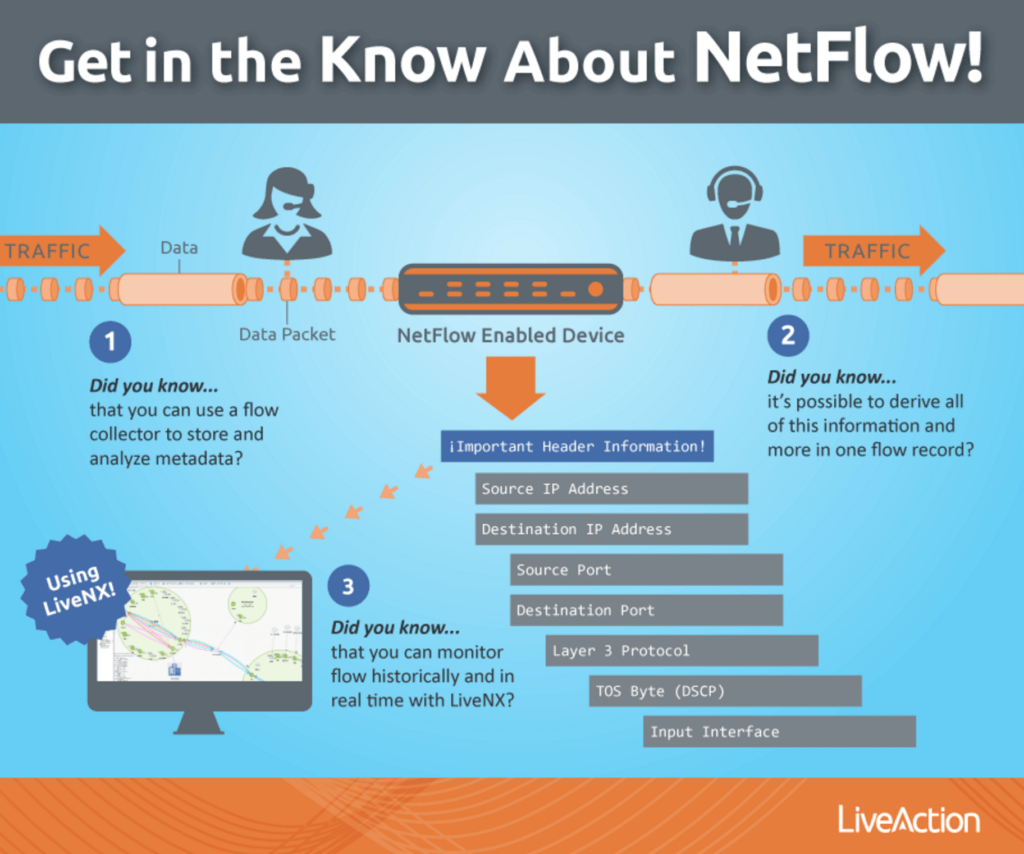
NetFlow is a network protocol developed by Cisco in order to collect and monitor IP network traffic. By utilizing NetFlow, IT teams can analyze traffic flow and determine the traffic source, traffic direction, and how much traffic is being generated. To help you better understand the NetFlow process, I like to use the following analogy from our Product Manager, Ulrica de Fort-Menares.
Think of NetFlow the way you think of a phone bill. When you get your phone bill, you usually see a record of conversations listed. The information regarding these conversations includes the time the call occurred, who was called, how long the conversation was, the actual metadata from the phone call–but not the actual audio data packet.
Why is this concept like NetFlow?
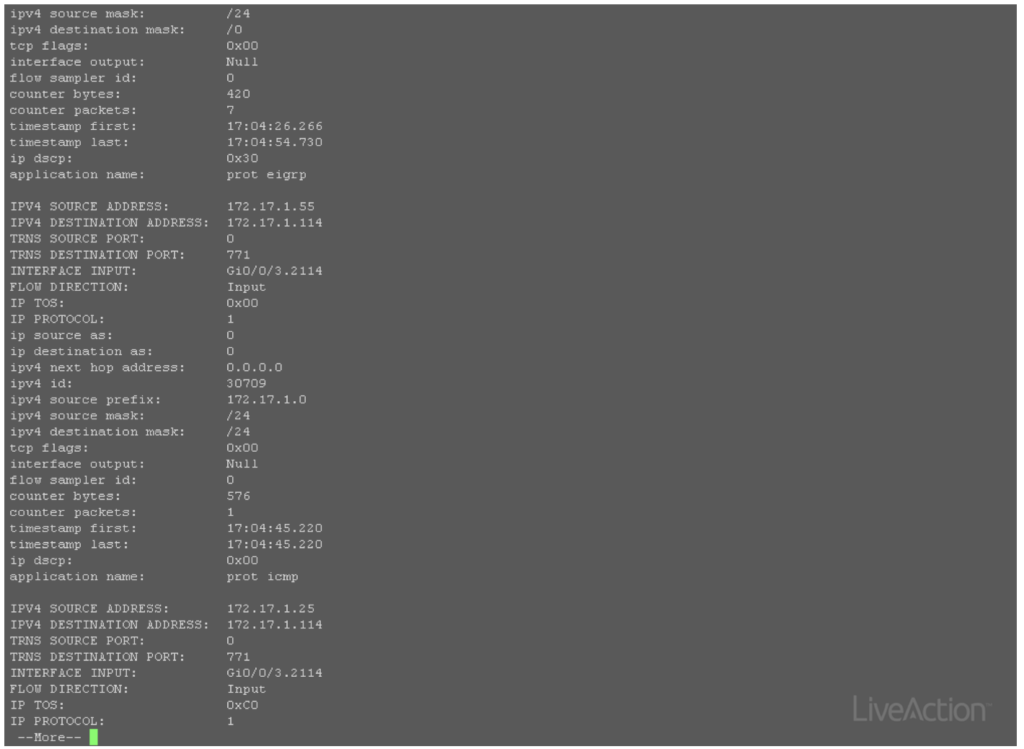
Similar to NetFlow, the header information for data packets that traverse through a device is stored in the device’s cache and then exported to a collector. A collector is very important to analyze NetFlow data. Without one, you could attempt to verify the cache for what data is currently traversing through a device, but as you can see below that is highly ineffective and time-consuming.
What about other flow types–sFlow, jFlow?
While NetFlow is a commonly used name for flow export, NetFlow is vendor specific to Cisco. jFlow is vendor specific to Juniper and sFlow is an industry-standard flow. The key difference between sFlow and NetFlow is that sFlow is sampled flow and NetFlow are not sampled. Fortunately, our network management platform, LiveNX, is vendor agnostic when it comes to our flow collection and if your device supports any type of flow export the data can be collected by LiveNX. Please see our specifications page for more information.
What do I do with the flow data?
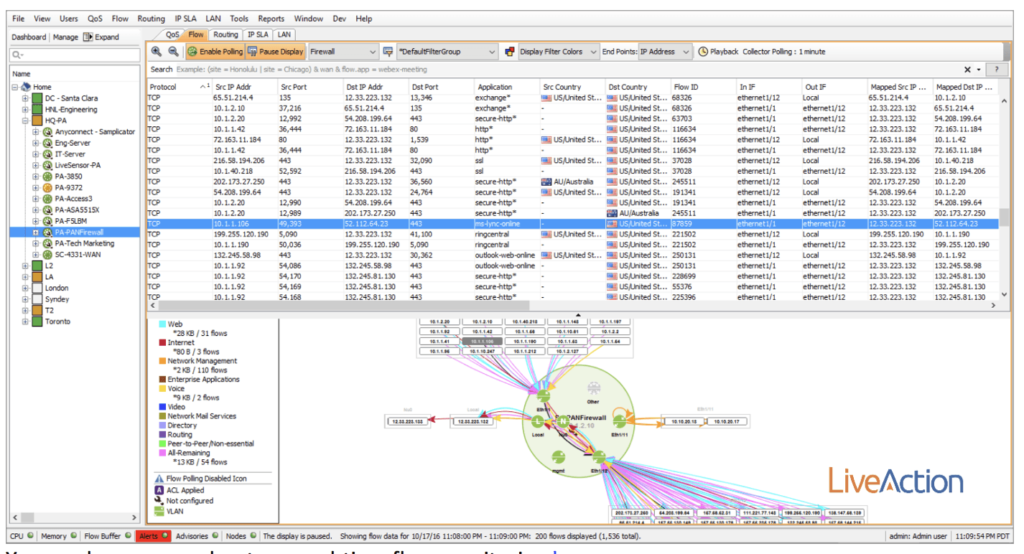
You could attempt to analyze a pcap if you had plenty of time, or more realistically you could use a flow collector to store and analyze the metadata to make sense of the information. For example, in the image below, I have a real-time view of a Palo Alto firewall being monitored by LiveNX. In the data set, I see a blue highlighted row that represents a conversation traversing through the firewall. Notice the information contained in this flow includes source and destination IP address, source and destination ports, TOS, utilization and even an application name—all of this is derived from flow!
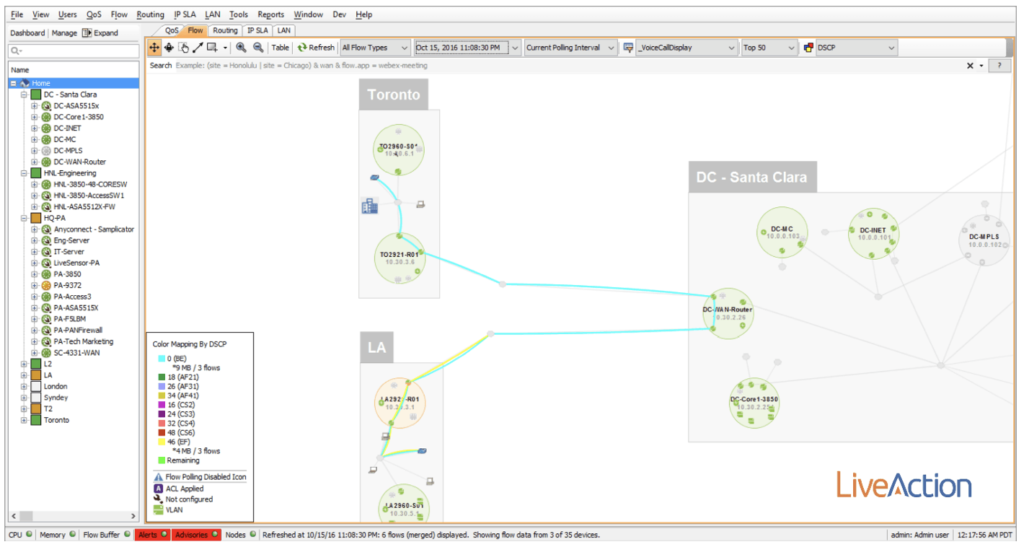
Using LiveNX you are able to take that flow metadata and visualize it across a topology to track a conversation through the network. For example, in the image below, I’m focused on user voice calls between the LA and Toronto offices utilizing a filter based on subnets and ports. Notice anything strange about the DSCP markings?
Using flow data, it’s also possible to better understand and manage WAN bandwidth (BW). In the example below, I’m able to see that most of the outbound data on the GE0/0 is video-over-http. I can also see the total utilization for a specified time range, as well as average and peak-rate information.
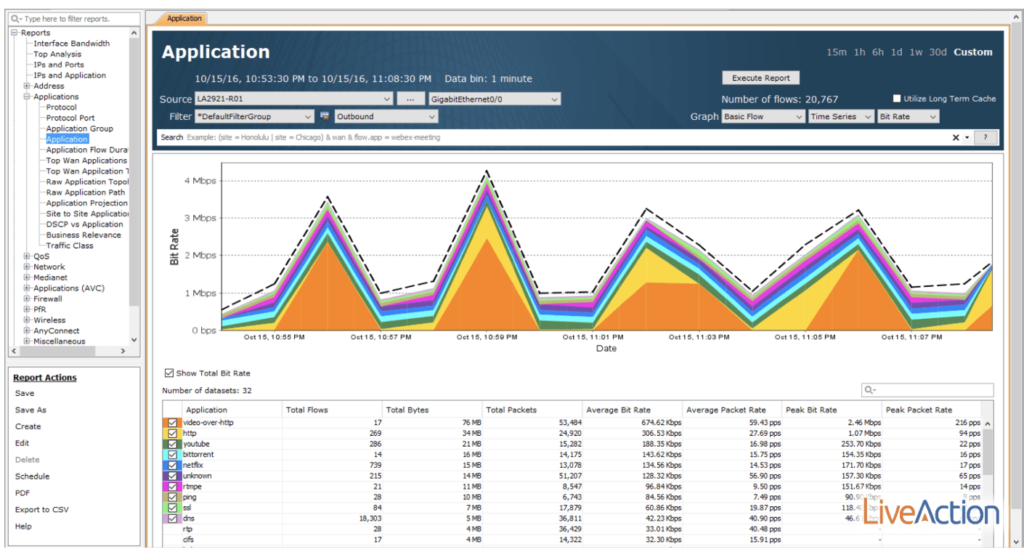
As more and more applications fight for expensive BW, flow data becomes the path of enlightenment in the network. In the past, if you were to traditionally derive this information, it would take the deployment and management of probes. Now, just by enabling features already available on your devices, you can export flow data to a solution like LiveNX—ultimately helping you to analyze and make sense of the collected metadata.
Read more about sFlow here: sflow.org
View the NetFlow RFC here: ietf.org
Date: October 26, 2016
Author: Alex Cameron

