Having worked with customers for over 20 years on how to best use LiveWire and Omnipeek software, I have seen how our recommended best practices for using these products most effectively, has changed and evolved over time. This article talks a little bit about how we used to recommend using the products and how we recommend using them today, and what configuration changes can be made to get the best performance.
A Quick Overview of LiveWire
 LiveWire is software to capture and analyze network traffic. The software runs in virtual environments and on specialized hardware. Omnipeek is a protocol analyzer application for Windows. Omnipeek can capture network traffic locally from one of the built-in network ports, and connect to LiveWire. LiveWire is server software that uses high-performance capture cards and has its own web-based front-end called Omnipeek for Web, or PeekWeb for short. LiveWire can be deployed and used on its own in a data center, at the Edge, or in the cloud. Any number of LiveWires can be integrated with LiveNX, where LiveNX becomes the single pane of glass for all of the LiveWires.
Out with the Old
A long time ago, before Savvius was acquired by LiveAction, and even before WildPackets was renamed to Savvius, the recommended use case for LiveWire, which at the time was called Omnipliance, was to create different captures on different interfaces with different filters and settings, and capture packets on demand. This was mostly limited to reactive troubleshooting, where a problem was reported and had to be reproduced in order to capture and troubleshoot it. Wow, have we come a long way.
In with the New
In today’s version of the LiveWire software, the recommended use case is to create a single capture called a LiveFlow Capture and leave it running forever. A LiveFlow capture is a special kind of capture that not only writes the packets to disk as they are being captured, but at the same time analyzes the packets, and generates IPFIX flow records, which are sent to LiveNX. The LiveWire PowerCore can capture up to 17Gbps, save all of that to disk, and generate flow for all of that traffic at the same time.
What is LiveFlow?
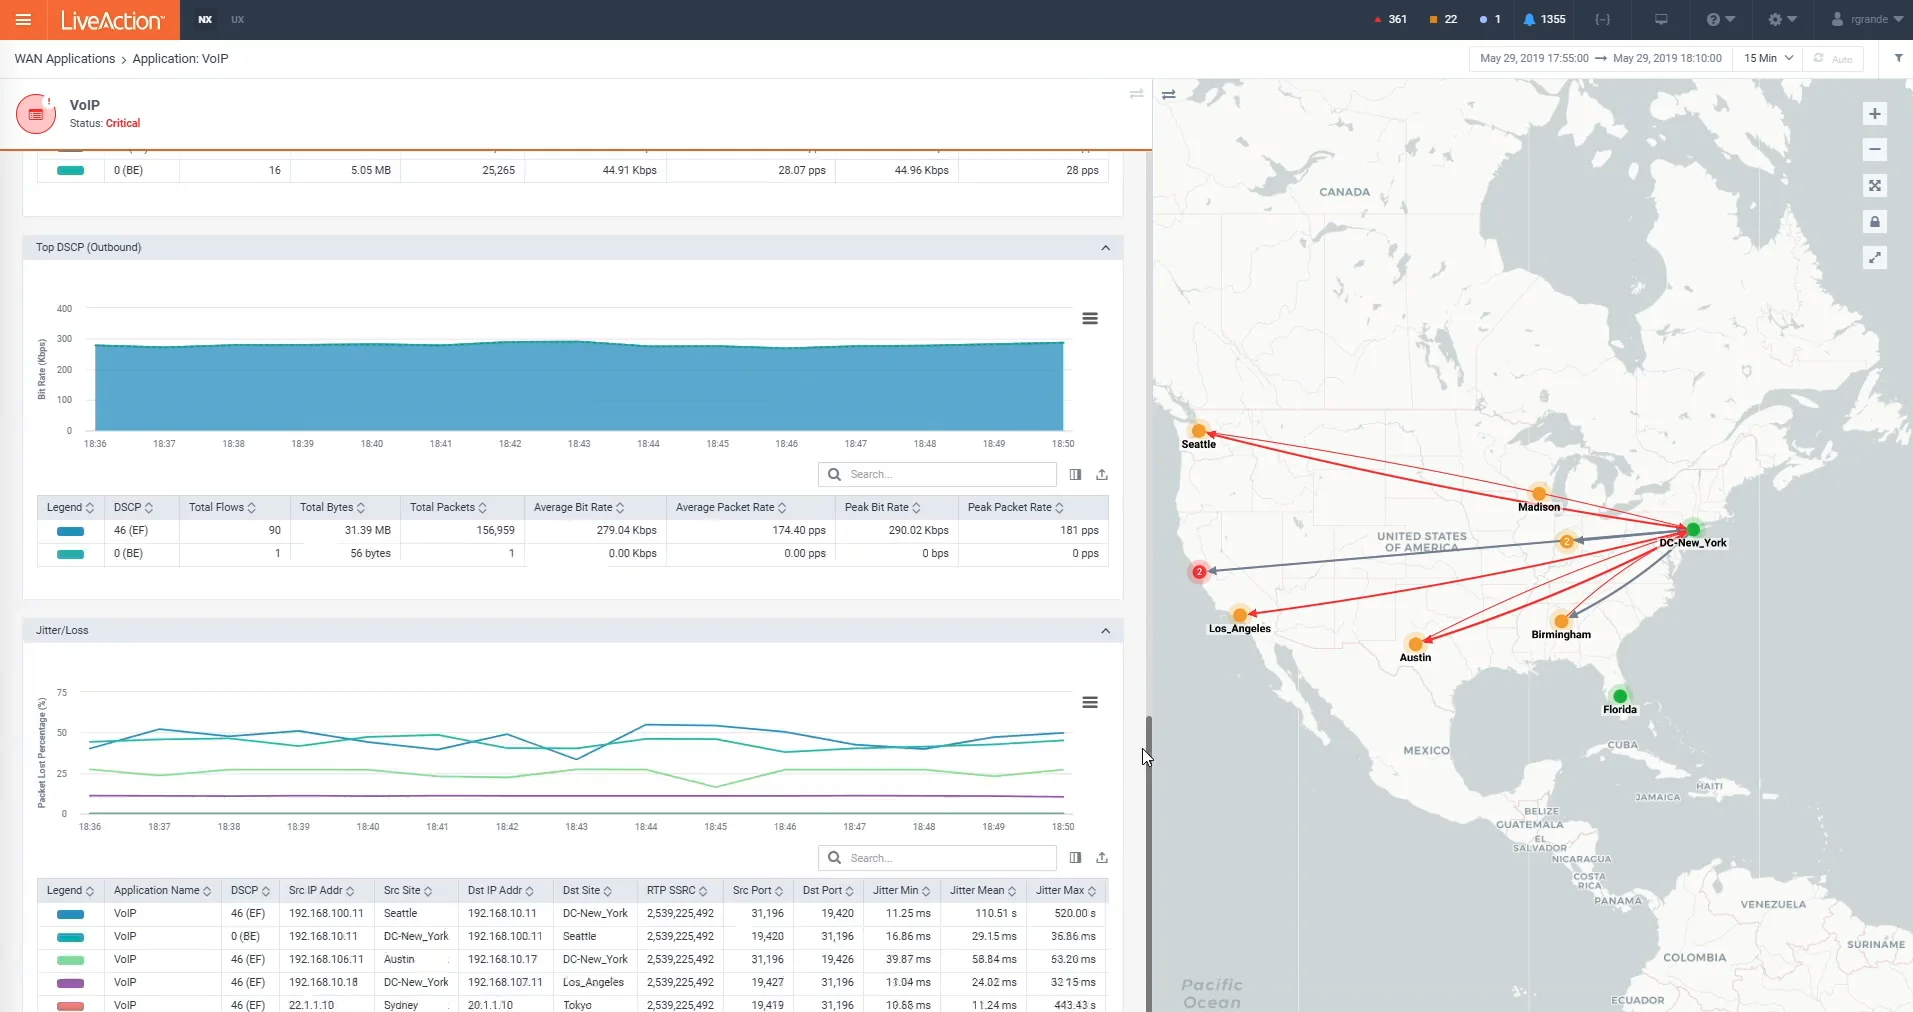
The IPFIX that LiveFlow generates is called LiveFlow. LiveFlow can be compared to the IPFIX generated by Cisco devices because it consists of Basic flow, AVC, and Medianet. However, LiveFlow extends the Cisco IPFIX with performance measurements like tcp quality, latency and jitter, and phone numbers. These all flow up to LiveNX, which is used for reporting, and to alert on thresholds. When thresholds are exceeded, generating alerts in LiveNX, the alerts can be used to cross-launch back to the packets in LiveWire. The cross-launch performs a forensic search which finds all of the packets in the flow and analyzes them at the packet level, rebuilding the flows, calls, peermap, graphs, decodes, and many other statistics and views that are used to troubleshoot the problem.
- Performance – Yes, you had to read a whole page of stuff to get here. The main reason I am asked to get on calls with customers is to help them tune or configure their LiveWire software for the best performance. And the best performance means capturing at the highest throughput possible, without dropping any packets. As I mentioned before, the highest LiveFlow performance on our biggest most powerful appliance, the PowerCore 3100 (Roar!) is 17Gbps.
We also offer JBODs or extensible storage units that increase the amount of time you can retain packets. In pure capture to disk mode, these JBODs also increase performance to 40Gbps because we can write the packets to more disks at the same time. However, in LiveFlow mode the JBODs do not increase performance because we are CPU bound. In other words, the limitation is in how fast we can process the packets to generate flow. And this is one of the major differences between the old recommended use case and now.
Before LiveFlow, all of our analysis was single-threaded. We captured all of the packets and analyzed them on a single thread, one at a time. With LiveFlow, we use the ability of the hardware to load balance the traffic by flow to 16 different cores and analyze the flows in parallel. Clearly, this is way faster. Now days, the slower, single threaded deeper analysis is done as part of the Forensic Search, so it does not directly affect the capture performance. And as part of the Forensic Search it is done using a filter, usually on a single flow, or a small number of flows, for a small period of time.
With a LiveFlow Capture, all of the traffic is captured all of the time with enough analysis to send to LiveNX for reporting and alerting, and to get the packets and detailed analysis for troubleshooting, any number of Forensic Searches can be performed at the same time by different members of the team, or teams, and shared, or exported to view locally in Omnipeek, or some other tool.
- Configuration – In a LiveFlow Capture, there are certain details about the configuration that should be considered and possibly changed to achieve the highest performance. Basically, the more analysis you enable, the lower the performance is going to be. The rule of thumb is how much analysis you enable depends on your throughput or data rate. If you are doing less than 10Gbps, then turn it all on and you should be fine. As you get above 10Gbps, many factors can determine performance, and you may need to start tweaking the configuration and disabling certain analyses in order to get the best performance and not drop packets.
- htop – As you are making these changes, one way to check where you stand on performance and how close you are to dropping packets is to putty or ssh into the LiveWire and run htop. At the top of htop you will see a horizontal bar for each core. These bars show the percentage of each core being used, and if you count you will see 16 of them are pretty active. They should be equally active because the packets are being load-balanced across them. If they are not, your traffic is not well balanced. This can happen if some flows are much more active than others. But anyway, if any one of the bars reaches 100%, you may start dropping packets. I say may because there is buffering that can help to handle bursts, but only for a short period of time.
- File Size – First of all, change the File Size from 1024 to 4096. The result is that instead of rolling a file over when it reaches 1GB, it will roll over when it reaches 4GB. This will increase performance because there is a small overhead when closing a full file and opening a new file. And when you are capturing at 10Gbps, you can rollover 3-5 files per second.
- Disk Allocation – There is a slider that is used to configure how much of the disk to use for the capture. With the LiveFlow Capture, there should only be one capture, so you might think to use all of the disk space. Don’t do that! Use about ¾ of the disk space, because the Forensic Searches are saved in the same partition as the capture files. And this leads into a whole nother conversation about making sure you clean up unused Forensic Searches. Some customers either go in manually or set up an automation to clean up the Forensic Searches every night. Good idea.
- CTD Stats – A few types of analysis can be performed in real-time and displayed in the Forensics View. The four major types include Timeline Stats, Top Stats, App Stats, and VoIP Stats.
- Timeline Stats – Timeline Stats are almost a must in order to see utilization and select a range of time when doing a Forensic Search. Timeline Stats are pretty cheap as well, and should not make or break your performance, unless you are right on the hairy edge, like maybe right at 17Gbps, and need to turn off everything possible in order to not drop packets. This may be ok if you do all of your Forensic Searching as cross-launches from LiveNX. You can also do Forensic Searches by selecting a range of files in the Files View. But having said all that, turning off Timeline Stats would be the last resort.
- Top Stats – Top Stats are not necessary for LiveFlow but can be useful in Forensic Searches to know if an IP address or application is within the range of time you have selected. On a PowerCore, if you are under 10Gbps, and know you have plenty of cycles to spare, then it can’t hurt. But I would recommend leaving this one off just because on a small monitor it pushes the Utilization Graph down, and you have to scroll up and down to use the page. Without the Top Stats, the graph is closer to the top of the screen.
- App Stats – App Stats are a big performance hit but are also important to have enabled in order to identify applications in LiveFlow and to analyze latency. However, if you do need to disable App Stats, LiveNX can identify most applications using the IP and Port information from the flow records. In LiveNX, if you see a * in front of the application name it means LiveNX figured it out instead of LiveFlow.
- VoIP Stats – VoIP Stats are not necessary for LiveFlow. I recommend leaving this one disabled. If you do have them enabled, and you have a lot of VoIP traffic, this can be a big hit to performance. You will though have some VoIP analysis in the Forensics View graph.
- Packet File Indexing – The Packet File Indexing feature will index information about packets in a database. This will decrease capture performance but potentially increase Forensic Search performance. Potentially, because it depends on how often what is being searched for is in an indexed file. There are a couple of different fields you can index on. The most common, and least expensive are IP and Port. The most expensive is the application. So choose wisely.
For example, if you enabled IP and search using an IP filter across a range of time consisting of 500 files, and that IP is in none of the files, then the search is going to be super fast. This is because the search did not have to even open a single packet file because it just used the index database. If the IP is found in the index database for a file, the whole packet file with that index has to be searched, even if there was only one packet with that IP in it. So, you can see how if the IP is in just a few files, the search is going to be much faster. On the flip side, if the IP is in every file the search is going to be as slow, if not slower, than if the packet file index for IP was not enabled.
Packet File Indexing is also affected by the File Size we talked about earlier, since the bigger the file, the less has to be searched in the no-hit case, but the larger the file, the more has to be searched in the hit case. Also, the smaller the file size, the more index databases there will be. This can become an issue if the index database files use up all the disk space in /var/lib/omni/db. If this happens the index database can be moved to /var/lib/omni/data, which has much more space. But of course, then you are sharing the index database with the packet files. Yes, it is all a balancing act.
- LiveFlow Options – In the LiveFlow section of the Capture Options Page there are a few options to be aware of, and consider changing.
- Turbo – Who would not want something called Turbo? Turbo is only relevant for LiveWire Edge and LiveWire Virtual. Turbo uses the hardware to load balance the packets by flow and analyze them across all of the cores. As I mentioned before, this happens by default with the PowerCore, and the Core, but the Edge and Virtual it must be enabled. Turbo can increase performance significantly, but also has some limitations. For example, when a LiveFlow Capture is in Turbo mode, other captures cannot be created on the same interface
- Signaling DN – This feature enables the phone number search from LiveNX. It is a very useful feature if your use case is users calling you with a VoIP phone number that is having performance issues. In LiveNX there is a Search by Phone Number Page that you can enter the phone number into, and it will list the calls with that phone number, which you can then use to cross-launch to in LiveWire. Amazing! However, it is a big performance hit, so if you need to cut corners, this may be a good place to start.
- Capture Sessions – When you change configuration options for the LiveFlow Capture, the capture will restart. This will result in a new Capture Session which you can see in the Forensics View. When a new Capture Session is created you will only see the utilization and other statistics in the top graph for the current Capture Session. However, cross-launching from LiveNX will still search through the files of all Capture Sessions. Also, once the amount of disk space allocated for a LiveFlow Capture is used up, and old files are removed to create new files, which is the rollover process, and the oldest files will be removed from the previous Capture Sessions, and when all of the files for a Capture Session are gone, the old Capture Session will go away. And when all of the previous Capture Sessions are gone, you will be left with only the current Capture Session.
Push the PowerCore 3100 to the Limit
So those are the major configuration changes you can make to get the best performance out of your LiveWire deployments, along with how some of it works under the hood. Customers have been asking me to write this down for a while now, so I hope you find it useful as well. These recommendations apply to all versions of LiveWire, including LiveWire Virtual and LiveWire Edge, but are most relevant and useful to push the PowerCore 3100 to the limit. If you have questions about any of this, or would like one of our expert SE’s to walk you through the configuration, feel free to request a demo or a free trial.


