LiveNX 7.4 ready to offer full Visibility into Another 1M+ SD-WAN Devices
We’re in the business of bringing great network visibility management solutions to NetOps teams to support their mission of ensuring the application and networks perform, from the datacenter to the cloud to the edge, and everywhere in between.
LiveNX 7 and all of its incremental releases, were created to help customers’ transition to software-defined WAN’s while enabling them to get the best performance out of their current investments. And we’ve gotten great feedback and adoption of all of these capabilities (you can read about some of them here and here!).
But, the transition to SDN architectures is accelerating and many companies around the globe are just getting started. To help speed adoption, Cisco recently made it even easier for their customers with the integration of Viptela SD-WAN into Cisco IOS XE software, which runs on the ISR/ASR families of edge routers. As Cisco’s Anand Oswal, Senior Vice President, Engineering, Enterprise Networking Group shared in his recent blog post, “The release of [Viptela SD-WAN on] Cisco IOS XE provides an instant upgrade path for creating cloud-controlled SD-WAN Fabrics… Over a million of our ISR/ASR family of edge routers are in use by organizations worldwide.” Now Cisco will offer two SD-WAN edge families: the vEdge from the Viptela acquisition and now the cEdge, or Cisco Edge, that expands the capabilities across selected Cisco Integrated Services Routers (ISRs), Aggregation Services Routers (ASRs), and Enterprise Network Compute System (ENCS).
This is a pretty exciting development for Cisco customers of the ISR/ASR and ENCS platforms. The transition to SD-WAN got a little easier, and opens up the option to migrate to a cloud-based solution, for simplified operations, reduced costs and improved user experience. With any WAN migration, a redesign is needed for application benchmarking, capacity utilization, SLA classes, and service provider services.
Advanced SD-WAN Monitoring for Planning, Deployment and Network Operations
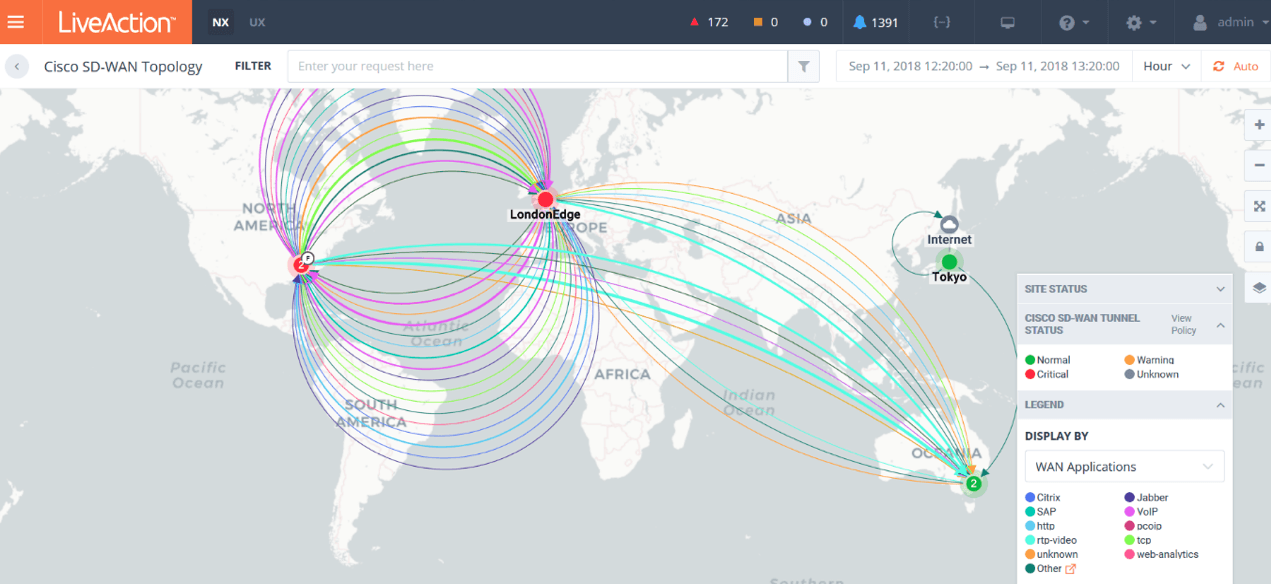
LiveNX – Application Performance by Topology View
This is where LiveNX 7.4 comes in with a complete lifecycle approach for performance monitoring and analytics from Day 0-Planning, Day 1-Verification, and Day 2-Operations for both vEdge and cEdge architectures.
Enterprises can look at SD-WAN as a unique cloud service with a standalone admin portal and add it to the list of IT performance tools, or they can have a multi-domain, multi-vendor, multi-cloud performance and analytics platform for the entire end-to-end organization and integrate SD-WAN monitoring into the platform. LiveNX is positioned as the platform for end-to-end visibility.
Redefining End-to-End Visibility and Diagnostics with Packet and Flow
LiveNX delivers deeper visibility and faster troubleshooting with continued integration with Omnipliance for packet capture and analytics, and Omnipeek for rapid diagnostics. Our acquisition of Savvius (formerly known as WildPackets) has brought great products, lots of smart network pros, and a better solution that will serve our customers’ network management needs.
To give network operations admins and network diagnostic and datacenter teams (NetOps) even more firepower when troubleshooting, LiveNX 7.4 further visualizes Omnipliance devices in sitemaps and summary views and enables the direct launch of Omnipeek capabilities in context for simplified workflows.
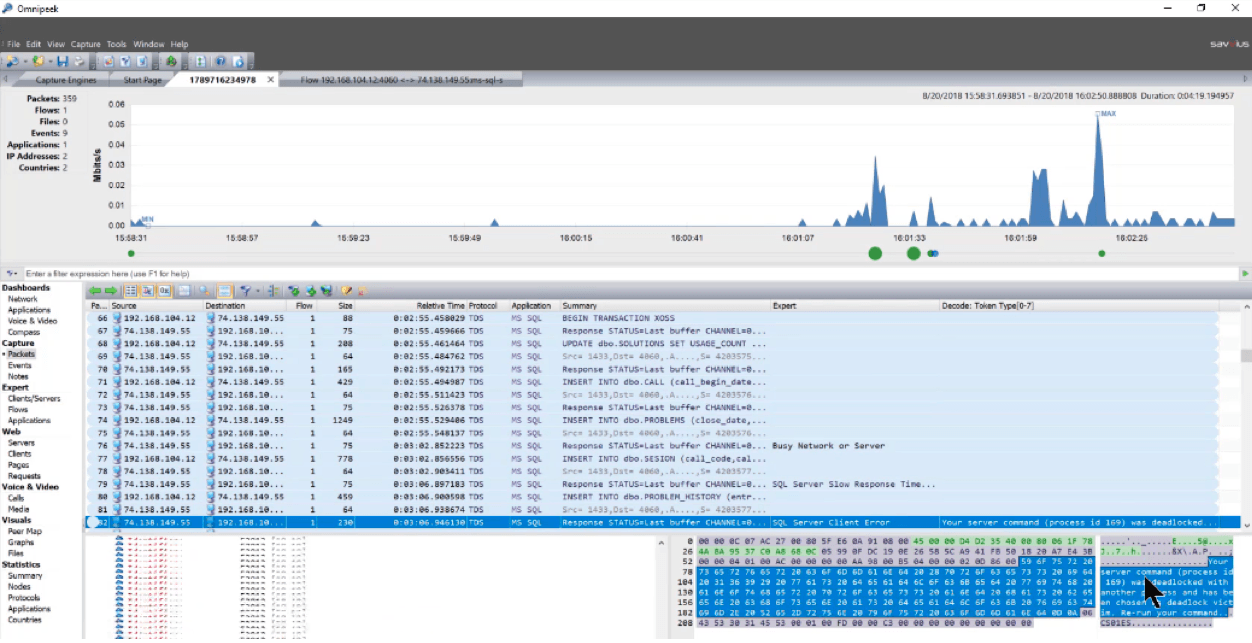
LiveNX Module: Omnipeek Protocol Analysis
This new capability helps NetOps teams that need active monitoring and visibility into topology views and alert notifications. As an alert is triggered, LiveNX timestamps it to let you know when it has happened. With an active alert, NetOps can now more quickly and precisely access relevant packet capture data from Omnipliance and analyze it with Omnipeek (and the time window can be just a few minutes, or the start of a series of captures). Rather than looking for a ‘needle in the haystack’ when searching and analyzing gigabits or terabytes of data, the drill-down to packet level analysis is quick and easy within LiveNX. This delivers faster incident isolation and resolution.
Visual Analytics in Operations Dashboard
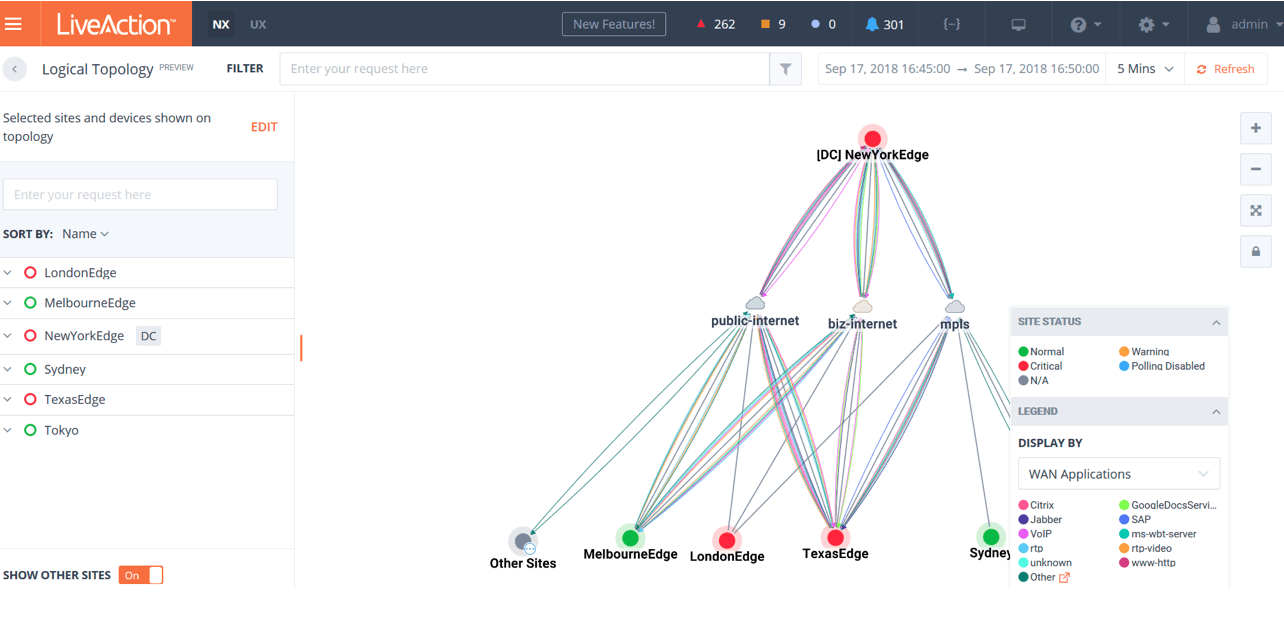
LiveNX [Preview] – Logical Topology
Innovation is about agile design methodologies, and LiveNX 7.4 delivers a new logical network visibility topology in the Operations Dashboard for multi-vendor, multi-domain visual analytics. If you’re a customer and use the java client, you’re now able to see end-to-end topology views, with a hierarchy structure including the datacenter, WAN, campus, and branches with filtering capabilities for applications and DSCP in the web-based client; stay tuned for more to come in 8.0
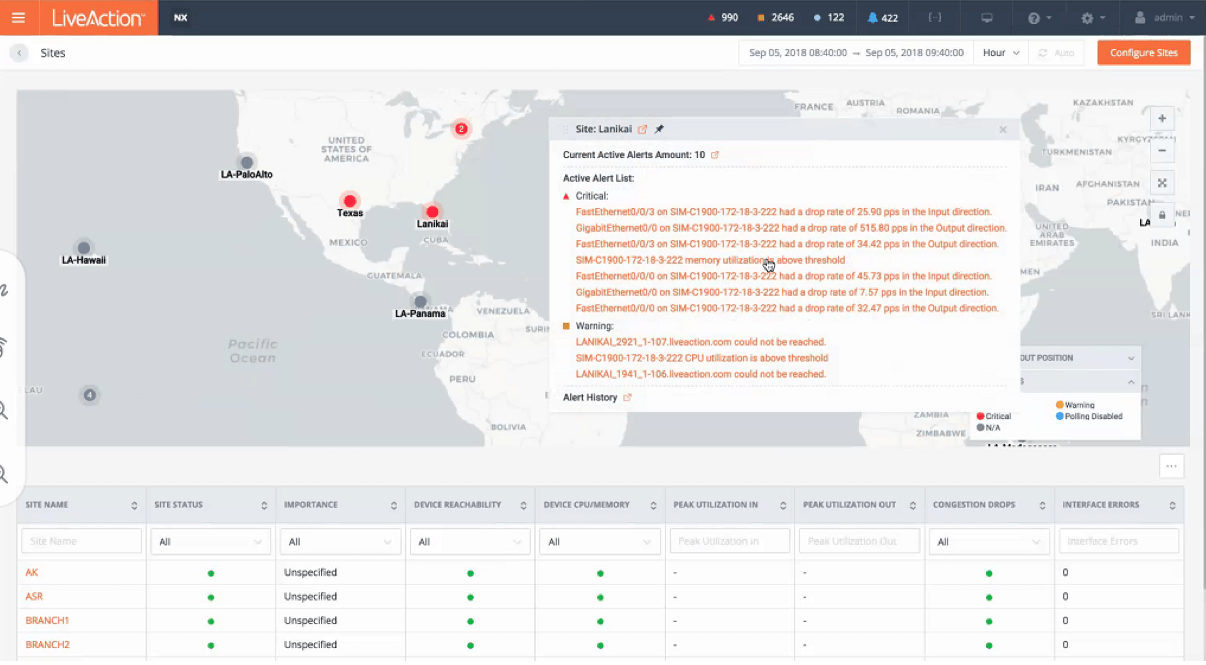
LiveNX – Active Alerts by Site
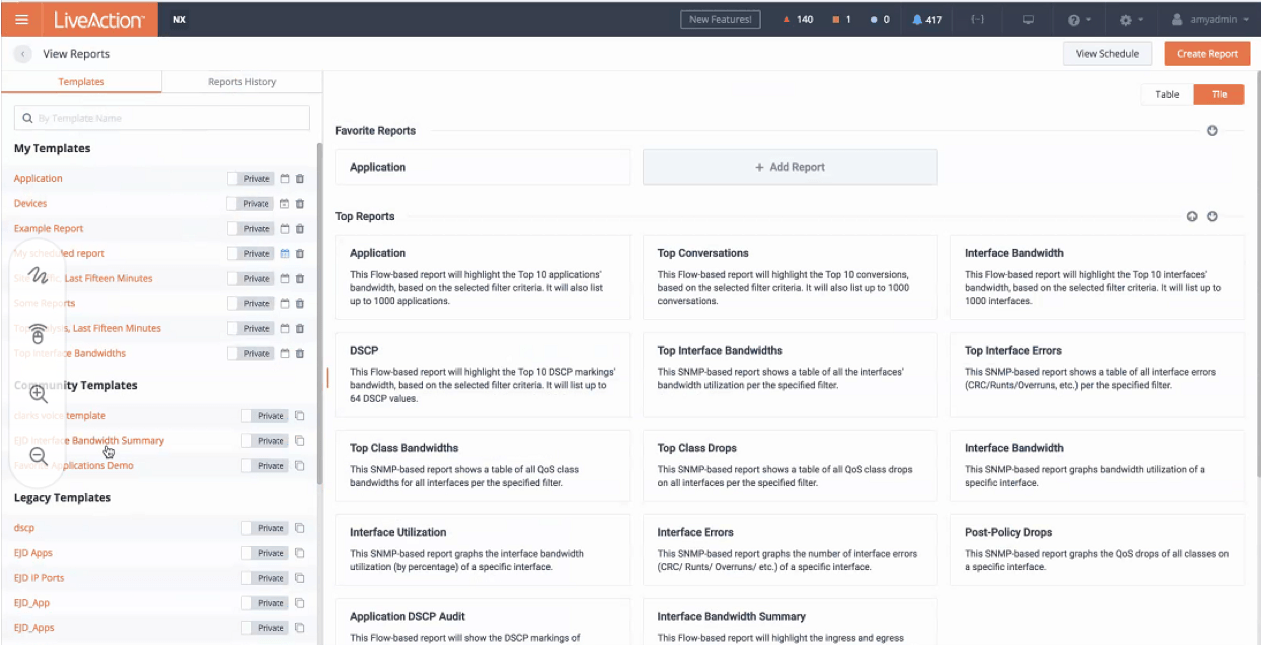
Reporting
- Support flow sampling for Juniper devices on Flow Reports.
- New dashboard reports page experience.
- Custom report names and descriptions.
- List of Favorites Reports.
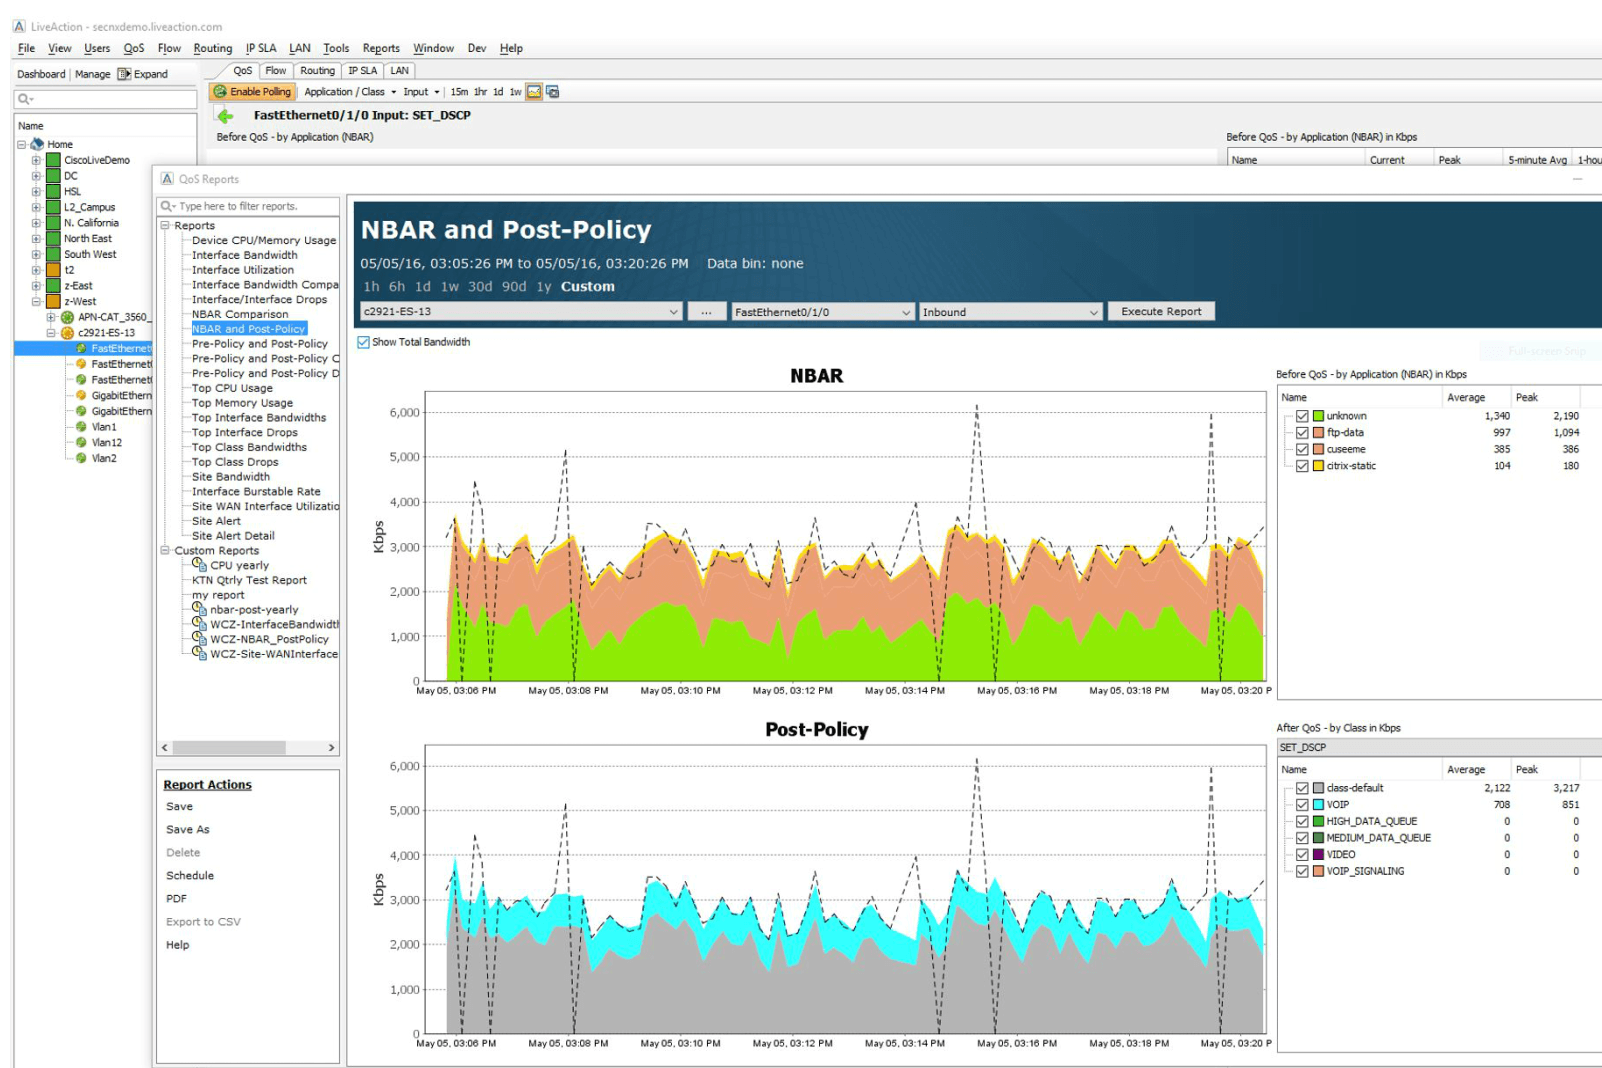
- Support Inbound and Outbound Separated direction in Top SNMP Reports.
- Permanently Enable Long-Term Processing for Top Conversations Report.
- Improved performance of aggregation processing for non-time-series reports.
- Top Analysis on the Operations Dashboard now supports IPv6 addresses.
Status Improvements
- Severity and Alerts configured in the Operations Dashboard.
- All views pertaining to Status provide the insight/capability to determine what Alerts are causing problems for the Site, Device, or Interface:
– Drill downs to the Alerts per Site, Device, or Interface are provided.
– Drill down specifically to an Alert is provided.
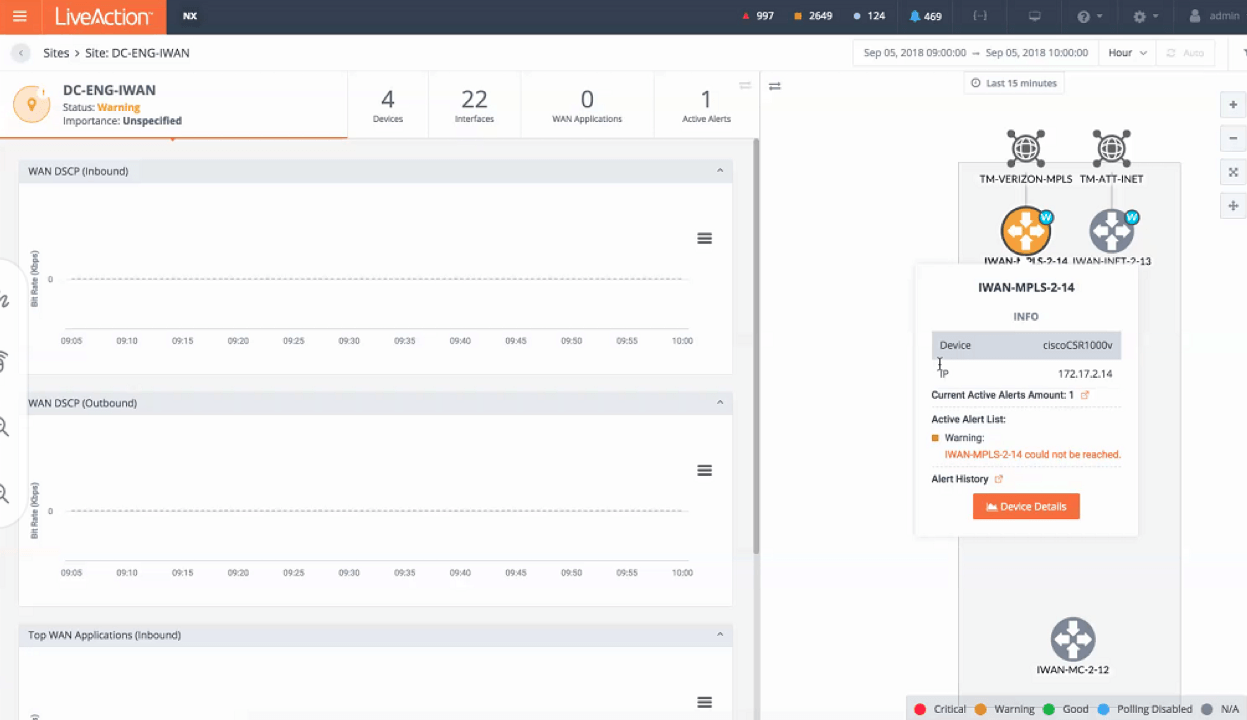
LiveNX – Site Level Device Alert
LiveNX is the next generation network performance management platform providing end-to-end dashboards, alerts, reporting, topology and stories (workflows). With LiveNX 7.4, LiveAction delivers the start of many great things. For more information on the latest release, click here.

